The Evolution of Enterprise Model Risk Management

Introduction

Model risk management (MRM) is the art of handling the inherent uncertainty related to mathematical modeling. We create algorithms for many different reasons. In the past, most models were built to study the evolution of dynamical systems (e.g. a credit risk model or a valuation model). Models were often created via a first-principles approach with analytical tractability in mind. Nowadays, ML models are everywhere, impacting both our individual behavior and changing the dynamics of entire societies. With such a persistent use of models, understanding the risks involved becomes mandatory since the consequences of model failure can be massive.

This is why there is a continuously growing pressure from governments and regulators to increase requirements for MRM and improve AI governance. Because of this evolution, financial organizations are looking at technology to address these challenges. In the current white paper we expand on this topic.

The current state of MRM

Looking across the industry, we see that institutions focus their energy on three different themes. First of all, there is a clear need for a more quantitative approach to model risk tiering (i.e. model risk quantification) which allows for more objective and more automated assessment. Secondly, the scope of validation is enlarging from focussing solely on regulatory models to including other items that are deemed critical. Lastly many organizations are looking at technology to industrialize the MRM efforts. Initiatives vary between identifying vendors to deliver an enterprise solution and building a solution in house using open source components.

Model risk tiering

The effort needed to keep an entire model portfolio regularly validated is immense. Based on a fairly wide sample, the number of models in the inventory varies between 100 for a regional bank to several thousands for global institutions.1 This number moreover increases by 10-20% yearly driven by the introduction of new model types (such as machine learning models) as well as new regulatory or accounting frameworks (such as IFRS9). The average time spent per model validation is 4 – 6 weeks,2 which leads to a fairly large workload. Taking into account that models have to be re-validated every time material changes have happened, or when e.g. the context has evolved, this workload is moreover recurring.

In order to manage the tasks efficiently, many institutions are evolving towards so-called risk-based prioritization. Concretely this means that the bank defines a set of model risk tiers that represent the amount of model risk carried by the model. The tier is driven by both qualitative and quantitative assessments, Based on the risk tier, the frequency and extent of (periodic) validation will vary.

In general, qualitative assessments that are input to the risk tier are slowly evolving over time. Indeed aspects such as model complexity or regulatory impact will not change overnight. On the other hand, quantitative assessments such as data quality or model performance do change quickly. This is the reason why this part of the tiering exercise, and related to this, the quantification of model risk, needs automation.

Although model risk tiering and quantification of model risk and uncertainty are very powerful concepts, the actual definition is not straightforward. This is because the concept of model tier is a

multi-dimensional quantity, meaning that we cannot summarize the risk in a single number, much different from e.g. market risk. For model risk, the three main components are:

  1. Model quality: this includes data quality, data stability, model performance, difference with alternative approaches etc
  2. Compliance with regulations: This in itself is a challenging topic because the regulatory impact in itself is a relative concept. Indeed, for a large global institution, the risk associated
  3. Misuse of models: One of the key questions related to model risk is to verify if a model is fit for purpose. This is however not a static judgement because both data and use of the model can gradually change over time. Properly defining this and measuring the risk for misuse is a challenge common to many institutions.

to a particular model that is used in a small country (such as Belgium) should be minimal, for the local supervisor, this model could be one of the most critical ones that are available in its remit

1 https://www.mckinsey.com/business-functions/risk/our-insights/the-evolution-of-model-risk-man agement
2 https://www2.deloitte.com/content/dam/Deloitte/dk/Documents/financial-services/deloitte-nl-g   lobal-model-practice-survey.pdf

Model risk tiering

More than regulatory validation

Customers are gradually becoming more sensitive with respect to the impact of algorithms on their daily lives. This is of course driven by the multitude of events that have happened recently related to the discovery of bias or unfairness in AI.3 Deploying a model that develops this type of issue is therefore a large reputational risk.

When dealing with these issues, the most important task is to create sufficient governance around it which implies a.o. that the various types of potential model issues are exhaustively listed, measured and -if necessary- remediated. In the context of AI, the main points of attention are:

  • Bias: meaning that the decisions of the algorithm show a systematic trend based on a particular feature of a client that is deemed incorrect. This type of issue often appears when the data is unbalanced. Minorities are -by construction- underrepresented in the datasets that are used for training, and as a consequence the algorithm will generalize on those data points, which can lead to unwanted outcomes
  • Unfairness: meaning that the decisions depend on a so-called protected feature which is an input on which we do not want the model to be sensitive. Examples of protected features can be race, gender, mother tongue, etc. The challenge here is to define clearly what behavior the algorithm is expected to display. Demographic parity (i.e. enforcing the same result for the various values of a protected feature) is not always considered fair either.
  • Explainability: When algorithms are used to make impactful decisions, it is important to be able to explain the decision itself. This requires at least an understanding of what were the driving factors leading to this particular result but does not necessarily require algorithms to be overly simple. A famous example of such local explainability technique is LIME. 4
SIM Card

3 See e.g. https://www.bbc.com/news/business-50365609, https://www.reuters.com/article/us-amazon-com-jobs-automation-insight/amazon-scraps-secret-   ai-recruiting-tool-that-showed-bias-against-women-idUSKCN1MK08G and many more
4 https://www.oreilly.com/content/introduction-to-local-interpretable-model-agnostic-explanations-  lime/

In addition, due to various regulatory initiatives, most notably TRIM in the EU, the scope of model risk management is increasing. Some examples include:

  • Model monitoring, i.e. continuously verifying that the performance of models is not deteriorating. This is important to avoid the discovery of model failure after the facts
  • Better policies for model calibration: Models are often re-calibrated on an ad-hoc basis. It is important to have a proper procedure in place to decide when, and how, model parameters are being updated, especially when part of the calibration dataset is illiquid
  • Data quality: With the ever increasing need for more data (driven by the shift to more complex (ML) models), the need for high-quality large datasets is increasing continuously.

In search of efficiency

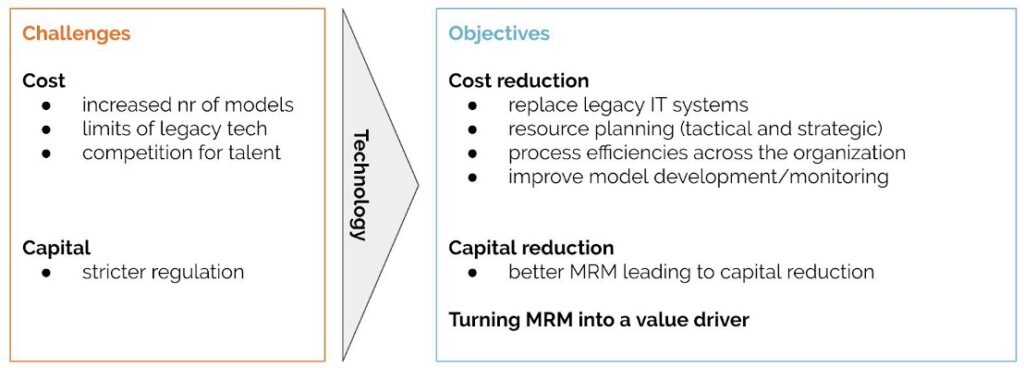
In the context of model risk management, the main challenges are cost and capital consumption.

The number of models in financial organizations is increasing by 10-25% yearly, and this is driven by the introduction of new regulatory requirements and accounting standards as well as the introduction of new types of models (such as ML-based algorithms). As an example of the former, the introduction of IFRS9 has caused a near duplication of the credit models in financial institutions. This is driven by certain requirements such as the fact that in IFRS9, credit models are point-in-time, taking into account the current position in the economic cycle, while IRB/Basel models are through-the-cycle, i.e. average credit risk across a long time period. An example of the latter is e.g. the use of a recommendation algorithm to suggest the best investment product to be marketed to a client. Even though the latter would (at least in the EU) not necessarily have to be regulatory validated, best practice suggests that these models have to be risk managed in exactly the same fashion. This gradual increase of the number of models in the model inventory leads to a continuous increase in costs.

In search of efficiency

Another cost-related challenge is the fact that many financial institutions are using legacy technology to support their MRM operations. However, due to the increased complexity of model risk as well as the fact that the structure of algorithms has changed over time, maintaining and customizing these legacy solutions is sometimes expensive. As an example, if a chatbot is introduced in a model inventory, it has several model components (such as algorithmic text preprocessing, word embeddings etc.). In addition, these components are typically derived from either a vendor or an open source engine and the same engine can be used in different applications. Although this is not entirely uncommon in more classical modelling applications, the emphasis on these features is stronger and these dependencies are often harder to encode in traditional model inventory applications.

A final driver for cost is the competition for quantitative talent that has shifted from traditional statistics towards data science. However, the need for data scientists has grown tremendously in other (high-tech) sectors which implies that financial institutions find it harder to compete for talent.

Regarding capital consumption, the main focus for banks is to either reduce capital add-ons or avoid them altogether by displaying sound model risk management to the regulators. A second point is to potentially reduce risk capital. Indeed, when computing market risk measures through VaR or Expected Shortfall (e.g. in the context of the IM for FRTB) the stability of the underlying pricing algorithms and market data generation models is crucial. If a curve generation algorithm is unstable in 0.5% of all cases, it will have a material impact on market risk. Good model risk management should lead to better models and therefore lower risk capital.

Requirements for technology

Given the current state of the MRM practice, it is natural that many organizations are looking at technology to meet the challenges that we highlighted in the previous chapter. In the current section we will now introduce two key requirements that have to be met by the technology choices made today.

Data-centricity

If we can gather all data related to MRM, we are able to transform the business. We believe two types of data are important: Analytics and Process related data.

Analytics related data

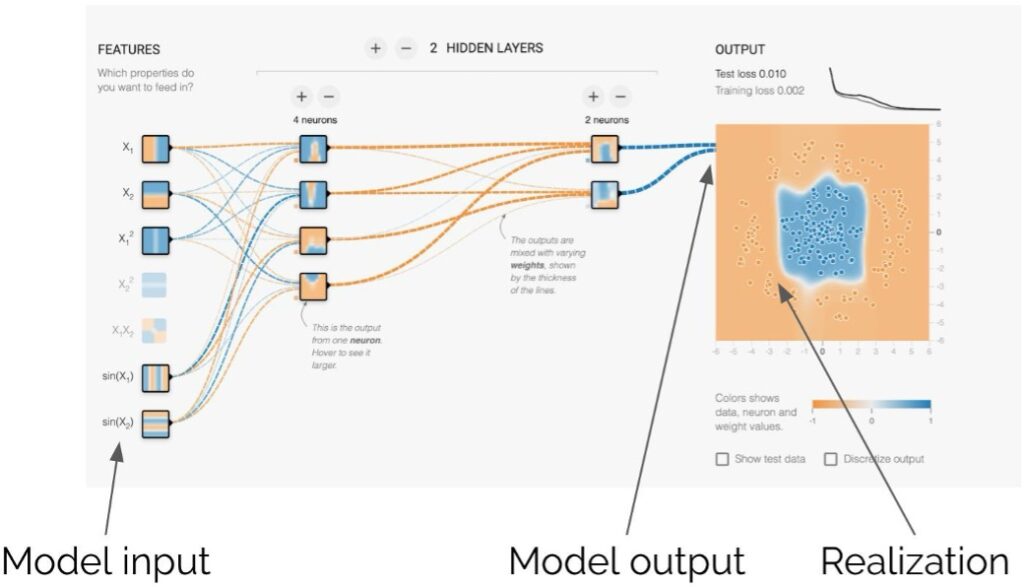
The first and most important data that is needed for efficient MRM is the so-called model execution trace, i.e. the data that is flowing through the models (model input, output and realization – see example below). For a given model, there are multiple types of datasets that are relevant:

  • The development dataset: the data that was used during model development and on which the initial testing and documentation happened
  • The calibration dataset: the dataset that was used to determine the best possible parameters for the model
  • The execution dataset: the dataset providing a snapshot of how the model is functioning in production

Note that the execution dataset can be updated continuously, while the calibration dataset is most often amended at a lower frequency and the development dataset hardly changes. If these datasets are always available, we can monitor models very efficiently and also test accurately that e.g. the development and calibration datasets are still representative for the current use of the model.

Data centricity

If this data is available, model risk managers can compute data quality and model performance metrics. As these metrics should be computed regularly, the underlying calculations will generate an entirely new derived dataset. Such a dataset can then again be analyzed to automatically detect deviations from normal behavior. As an example, suppose we compute on a monthly basis the performance of a set of thousands of credit scoring algorithms. In that case we can run an outlier detection algorithm on these time series to detect sudden change in the normal performance of the model.

Finally, as explained earlier, many organizations use a model risk tier to indicate the amount of model risk carried by a particular model. Depending on the tier the depth and breath of the model validation and monitoring process will differ. Some institutions take this one step further and start to quantify model risk e.g. by monitoring the difference between the model in production and a family of benchmark models. Both model tiering and model risk quantification generate again time dependent data. Being able to use this data to create e.g. a heatmap of model risk across the organization will help executives and managers to understand risk concentration and focus efforts on certain parts of the model inventory.

In conclusion, being able to centralize and make available analytics related data will allow organizations to:

  • Increase transparency of model risk across the model inventory
  • Drive cultural change since model performance will be available to the different lines of defence
  • Improve the overall quality of models

Process related data

MRM means managing the model lifecycle. This implies that various teams (model developers, model validators, auditors, risk committees, …) have to collaborate to move through the lifecycle efficiently. A good MRM system therefore should capture data related to this process such as

  • The amount of time spent per model per step in the life cycle
  • The number of iterations and communications between different teams
  • Quality measures of the documents that have been created (e.g. available sections, quality of written text, etc.)

Access to these datasets will allow managers to better plan resource allocation to meet internal and regulatory deadlines. Operational leaders will in addition be able to identify bottlenecks and streamline existing processes.
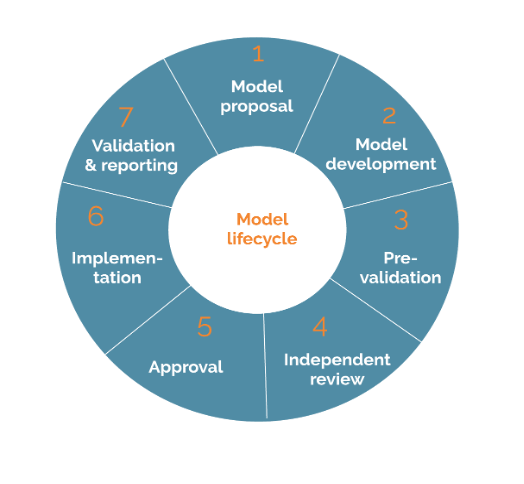
model lifecycle

Similarly, MRM departments should gather meta-data on the available datasets. This should include the growth rate of the data, the number of modifications/corrections applied on each dataset, the number of structural changes of the data, etc. Having access to process related data will allow a financial institution to streamline its MRM processes and improve its resource allocation strategy.

Based on the above, it should be clear that a good MRM system should have as a first key requirement the ability to collect, store and expose all data. This functionality needs to be implemented with an extensive authentication and authorization protocol to enable sharing of information while guaranteeing independence between teams.

Modularity

As a second requirement for technology we would like to advocate a modular design with strong integration capabilities. This requirement is driven by a few key observations.

First of all, there is the fact that MRM requires many teams across the organization to work together in a structured fashion. Since different teams often use different tools (driven by different needs) it is important to be able to integrate these tools in a single enterprise MRM solution. By introducing process engines it is possible to structure the processes without having to force everyone in a single tool that might not be fit for purpose for everyone.

As an example, model developers need the ability to quickly try out different libraries and techniques to create prototypes and identify the best possible approach. On the other hand, model risk managers who have to build benchmark models need a controlled environment to be able to guarantee full reproducibility of their validation reports. These competing requirements often lead to different tools: a model developer might use JupyterLab on his computer for prototyping, while the validator might use an environment that does only have a fixed number of modeling libraries available.

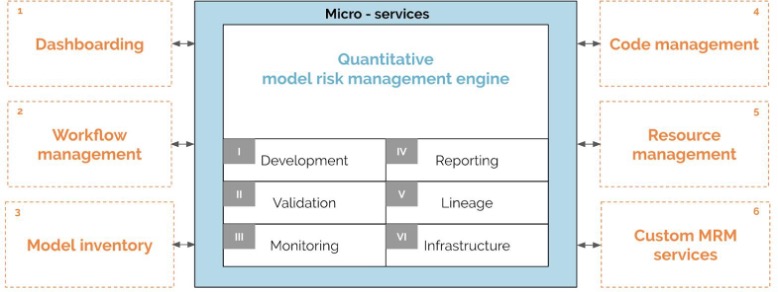
An example of a modular MRM system is schematically given below. The central module is a data-centric model risk engine with a controlled set of analytics libraries available. This engine can be used for prototyping, validation and monitoring. It centralizes all MRM data and keeps the linkage/lineage between datasets, models, analytics and reports. In order to do this efficiently and at scale, calculation infrastructure is required (e.g. HDFS, Spark, …). This central model risk engine module then has a set of API’s:

  • To retrieve and persist data
  • To trigger quantitative tasks (e.g. a monitoring analysis)
  • To retrieve reports
modularity

Using those APIs we can add additional modules (the orange boxes) such as:

  • Dashboarding to create various predefined views into the model inventory
  • Workflow engines to organize, execute and capture the results of MRM processes
  • A model inventory to represent the status of and dependencies between modelsSource control to keep track of all analytics-related code
  • Resource allocation to efficiently assign model developers and validators to certain tasks.

Examples

We would like to conclude this white paper on the evolution of model risk management by highlighting two important examples that illustrate these two key requirements for technology: data-centricity and modularity.

Model inventory

Model inventories are often represented in a fairly tabular format, where each model is a

so-called line-item with a fixed set of attributes. However, a crucial aspect of an inventory is to display relationships between the various items. These dependencies include the fact that the output of one model is the input of another one. This is a typical setup in e.g. market risk models where market data generation algorithms such as curve strippers and volatility surface calibrations feed into valuation models that build PnL vectors that are then in their turn input to a VaR or ES computation. Understanding these dependencies allows a model risk manager to verify the consistency of the limits that are put in place on various models. If e.g. the curve generator has a known issue with steep interest rate curves, it should be clear that this will have a material impact on the resulting VaR.

model inventory

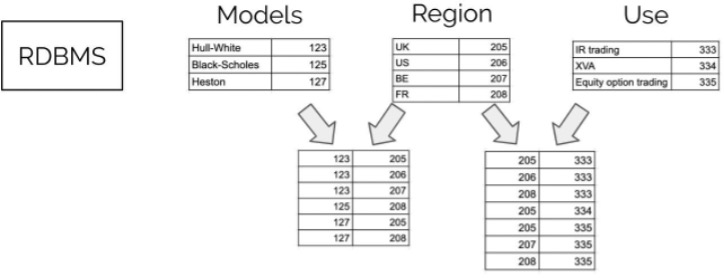
Representing these dependencies in relational databases is often difficult because it requires the introduction of so-called look-up tables. If e.g. the models are stored in a DB table and the Use is stored in a second one, then we have to create a third table that links entries from both tables together. This complicates queries, limits the scalability of the setup and makes it exponentially harder to add new fields and attributes to the inventory.

A good solution is to represent the model inventory in a graph database,5 for which many open source examples exist (such as Neo4J6). Graph databases represent relationships between objects explicitly. This leads to a much more natural representation that moreover scales well. Graph databases also have query languages similar to SQL (Neo4J uses Cypher) that allow a user to inspect the entire graph by querying recursive relationships.

A graph based model inventory is consistent with our two key technology requirements. It is first of all data centric, since it can naturally represent the inventory together with its dependencies (data feeding into the model, performance data, etc).

Moreover, contemporary graph databases are easy to integrate with and as such are a good example of modularity.
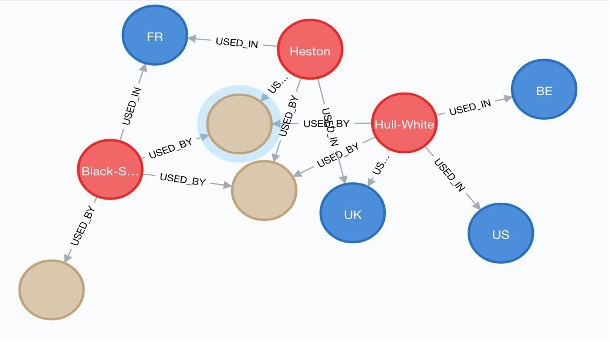
Model inventory

Executing business processes

As a second example, we would like to illustrate how to structure business processes. A systematic way to represent such process is to use the so-called BPMN7 (business process model and notation) 2.0 representation. This is a graphical language that can represent in detail all model risk management processes, indicating as well who/what team has to execute a task, which tasks are automated, what is the decision process, etc.

On top of this, once a BPMN process has been designed, it can be executed by a workflow engine. Since this is a standard, many open source solutions exist such as Camunda,8 Activiti,9 Flowable10 and many more.

Once a workflow process is deployed it can be executed, which means that the process will be run in a reproducible fashion, with all data being stored systematically. By doing so, an ad-hoc collaboration via email between different teams is transformed into a string of tasks that are executed in a systematic and reproducible fashion.

As an example, let’s look at a process to request for independent model review (IMR). The BPMN diagram is shown below.
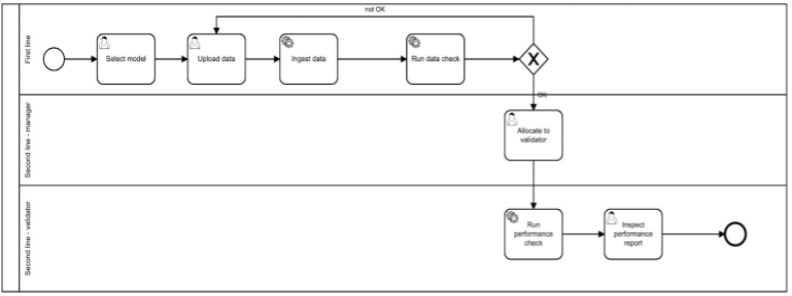
BPMN diagram

If a modeler is ready to ask for an IMR, she initiates a process. In a first step, she specifies the model that needs to be validated, and then submits documentation and data. After this manual task, an automated process is started to verify the quality and completeness of the submitted data. If issues are discovered, the modeler has to resubmit an improved dataset, if the data on the other hand is clean, the process continues.

At this moment, a task is assigned to the manager of the validation team to choose the validator that is going to perform this particular model validation exercise. Once done, a set of initial tests are automatically executed and after that the task arrives at the inbox of the validator.

By executing such a process, we put the responsibility of providing clean data entirely in the hands of the model developer, which is a huge efficiency gain for the validator. In addition, we start gathering data on the entire process which allows for further efficiency improvements further down the line.

This approach is again compatible with our two key requirements on technology: the setup is modular as the BPMN process engine is a separate entity from the quantitative validation engine and it is data-centric as we are storing all the meta-data related to process execution.

Conclusions

MRM is going through an industrialization phase. This transition necessitates the introduction of new technology to empower model risk managers to turn model risk management into a value driver. By investing in technology now, institutions will be able to capture the added value of advanced analytics in a sustainable fashion.

About the author

jos_gheerardyn

Jos Gheerardyn has built the first FinTech platform that uses AI for real-time model testing and validation on an enterprise-wide scale. A zealous proponent of model risk governance & strategy, Jos is on a mission to empower quants, risk managers and model validators with smarter tools to turn model risk into a business driver. Prior to his current role, he has been active in quantitative finance both as a manager and as an analyst.

Subscribe to the Yields Newsletter

Stay ahead with expert articles on MRM and AI risk topics, in-depth whitepapers, and Yields company updates.