Blog
News & Insights
Thank you! Your submission has been received!
Oops! Something went wrong while submitting the form.


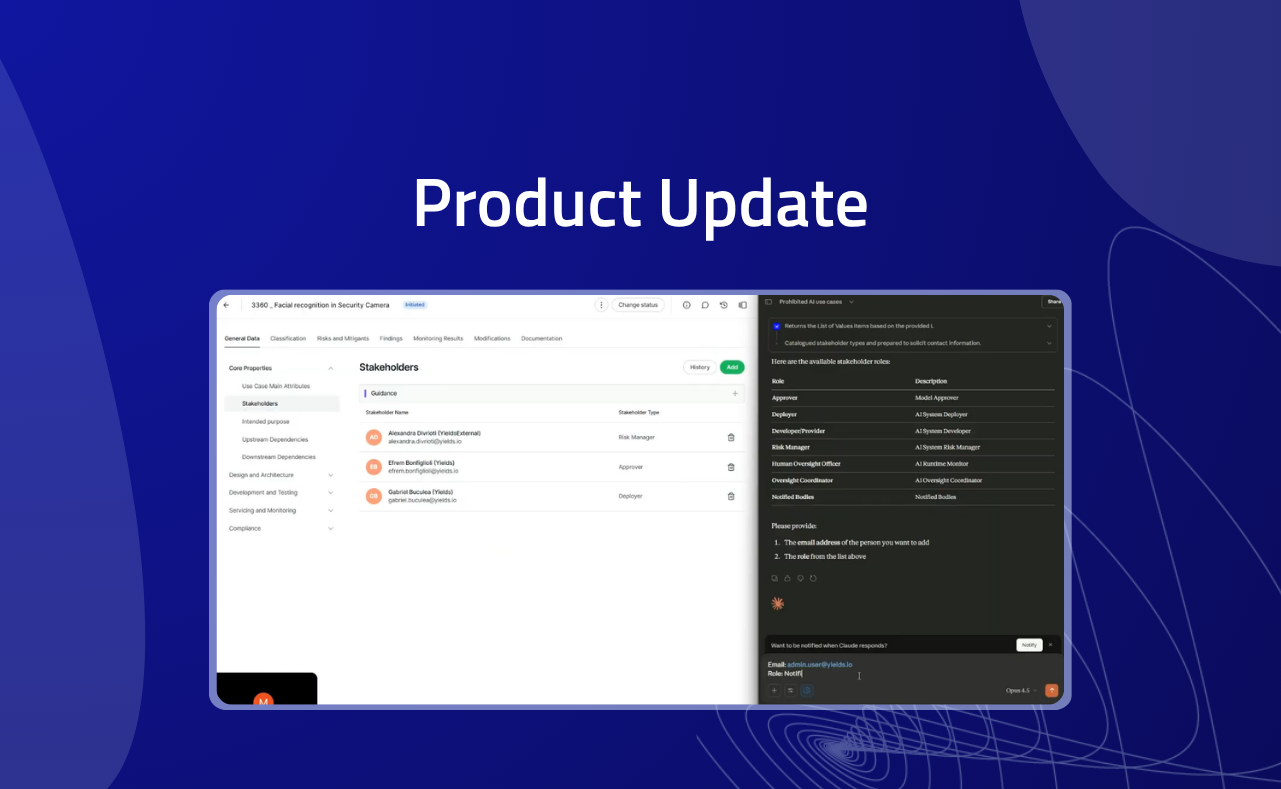
Unlocking the Future of AI Governance and Model Risk: Why We’re Building an MCP Server

March 26, 2026


.png)

.png)


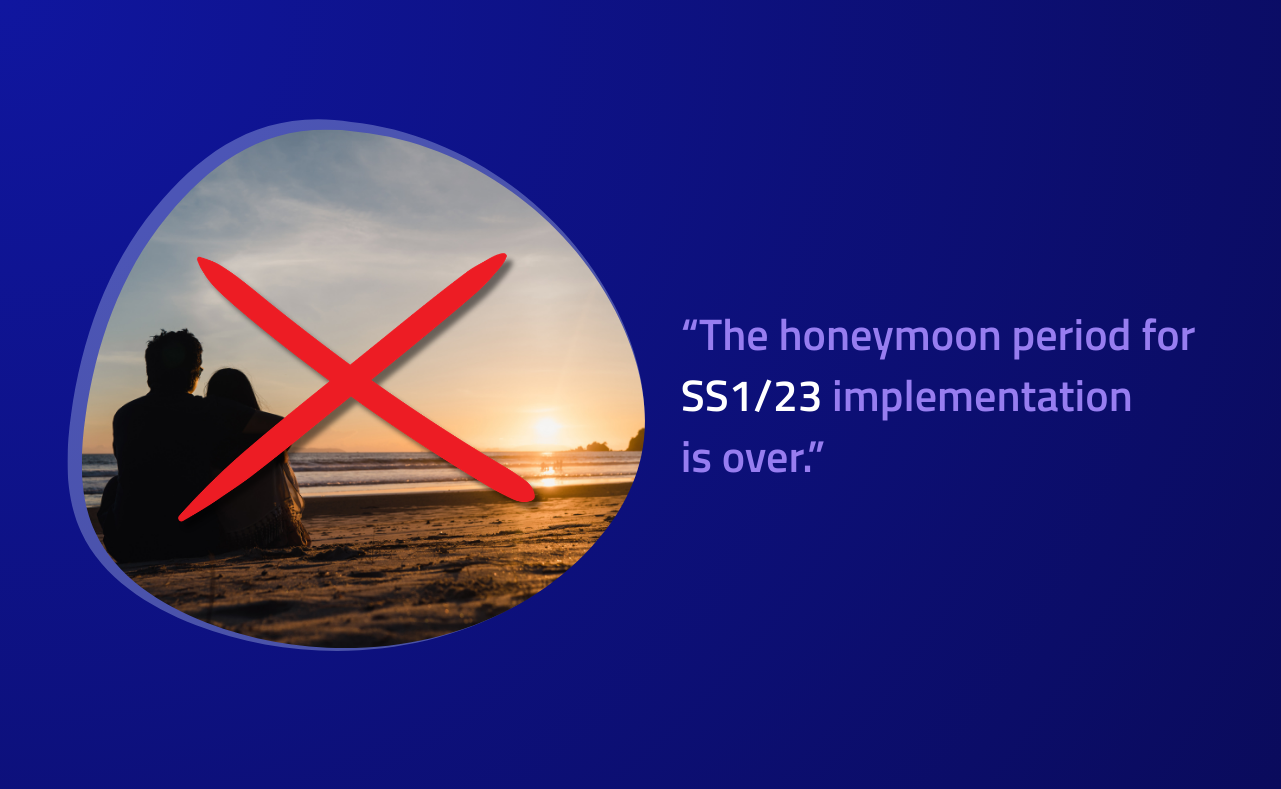
The end of the honeymoon: it´s time to turn PRA feedback on SS1/23 into a scalable model risk strategy

January 7, 2026


Partners Yields and Approach Cyber deliver first successful AI governance fast-track assessment with itsme®

November 19, 2025


Chartis RiskTech AI 50 Honors Yields for Leadership in AI Governance and Model Risk Innovation
June 24, 2025


There are no results with this criteria. Try changing your search.
